Real Application of Machine Learning in Customer Success
Artificial Intelligence and Machine Learning are buzz words thrown around whenever someone talks about the future of pretty much anything. Watching established industry leaders trying to explain how AI can be used in practical terms is like asking kindergarteners to explain relativity. Most can’t, and those who can are beyond special.
SaaS Customer Success is no outlier. A lot is discussed about the future of CS and how to leverage AI and Machine Learning to improve customer experiences. From onboarding to retention and growth, there are countless possibilities for how to use data to delight customers.
Hopefully, at this stage, you don’t have to sell the value of data to your organisation. Although, there is a difference between leveraging data to perform point-in-time descriptive analysis (what happened?) and diagnostic analysis (why did it happen?), and the ability to continuously predict and prescribe the next steps.
We often hear about giant technology companies using AI and predictive algorithms as a competitive advantage. Amazon, Google, Facebook, Netflix and Uber are just some of the examples of companies that built their business by leveraging data networks. I recently read an HBR article that showed that 50% of what Amazon users buy, comes from smart recommendations. The same article stated that Netflix prevented over $1bn in subscription churn thanks to their recommendation engine.
Due to the size and scale of these businesses, people assume that in order to use data as a competitive advantage, you need a huge number of users.
That’s a myth we will bust in this article.
Throughout this piece, we will explore the fundamentals of datagraphs (the visual layer powering ML), how you can deploy it as a competitive advantage in Customer Success, and what it takes to implement it successfully.
So let’s dive in!
What are Datagraphs and why do they matter?
If you want to use Machine Learning, you must get to know Datagraphs. Despite the self-explanatory name, the concept can be a little bit tricky to wrap your head around.
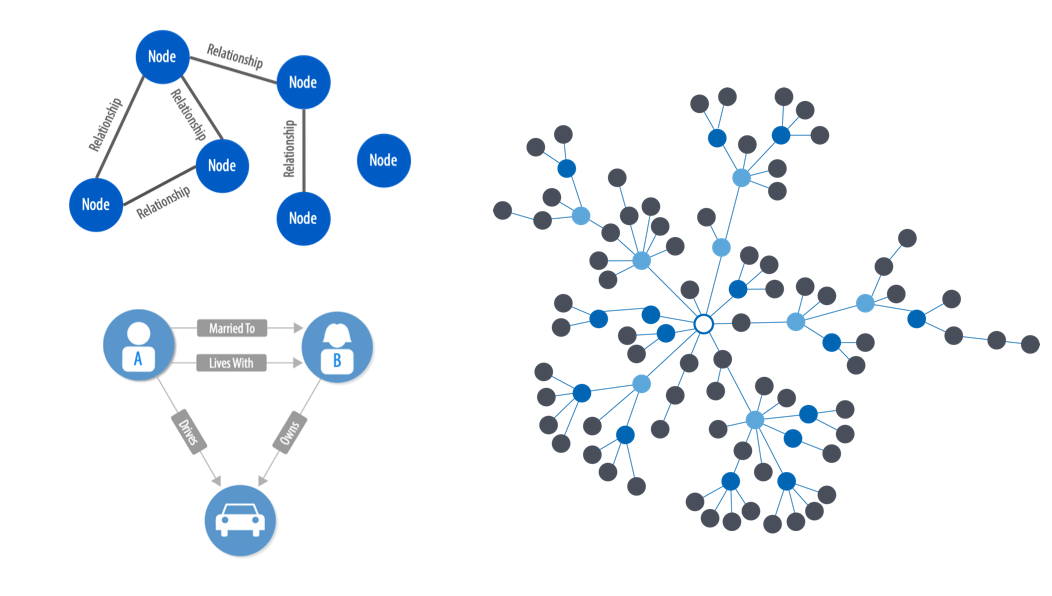
Based on the work of social psychologist Stanley Milgram, datagraphs organise data in nodes and draws relationships between the nodes based on a set of rules (if you fancy an in-depth review, check this Webinar).
The closest concept we have in mainstream business is process maps. Where one component can be connected to many others and the relationships are drawn through connecting dots. The key difference though is that it’s not a static map. It updates in real-time and continuously evolves as people engage with the product, generating more data that the system can use to learn from.
Amazon is a great example of this. As you use the platform and other users interact with products, Amazon is able to generate ever more accurate recommendations of what you are likely interested in.
Let’s say you are interested in buying a weighing scale. A “dumb” recommendation system might show you a series of weighing scales once you have already added one to your shopping cart. Make the system a little smarter and it might show you items in related categories like fitness and weight loss.
When you do the same in a super-smart shopping graph like Amazon’s, it will return a series of other products that you are likely to purchase with your weighing scale. It recommends items based on all your past searches and purchases, the music you listen to on Amazon Music, the books you consume through Audible, the shows you watched on Amazon Prime, what users like you are buying etc.
Each time you use any Amazon products, your digital profile is enriched in order to tailor all future searches, making results and recommendations more relevant to you.
On top of that, Amazon Shopping Graph uses a 3 pronged principle to make recommendations that people love: diversity (how different the recommendations are), serendipity (how surprising they are) and novelty (how new they are). They layer the psychology of shopping on top of Big Data.
This level of personalisation leaves you thinking maybe Amazon is listening to your conversations.
That’s why its recommendation engine is extremely successful. Today approximately 50% of all purchased items on Amazon come from suggested items.
Imagine if you could get 50% of your NRR without human interaction?
When we think of the example of Amazon and other successful datagraph systems such as Google Search, it’s easy to jump to the conclusion that a large number of users is needed in order to build a system as smart as theirs. But that’s not true.
Of course the more users you have the better, but data graphs are less about the volume of users and more about the number of interactions with your product.
If you have 100 customers with an average of 10 users per customer, there are 1K people actively using your product. If each of these users is performing multiple actions daily, you will build rich engagement data pretty quickly. This means you will be able to build something meaningful, despite having a small number of accounts.
When you have a small business, the argument might be centred on “we can analyse data easily right now”. But datagraphs are essential to scaling a business sustainably. You need fewer people to service customers when your system does it for you. And the results go beyond what any static analysis could create. The system learns with each interaction and over time creates exponential value.
How can you use data graphs to create a competitive advantage in Customer Success?
Customer Success teams exist to help customers realise the value of your product, thus, decreasing churn and increasing customer lifetime value (LTV).
Most customer success organisations will have 3 metrics of success:
- Product Usage
- Customer Satisfaction
- Net Revenue Retention
In general, if customers are using your product, and they are satisfied with the experience they are getting, they are likely to continue to use the product and possibly increase their usage.
In truly proactive CS organisations, Customer Success Managers pay special attention to product engagement. Their goal is to get customers to deploy more and more features of the product in order to solve their goals. Thus, embedding the product into key areas of a customer’s processes.
We call that “making the product sticky”.
The challenge with B2B SaaS is that given the number of users in each company, it’s hard to pay attention and take action at the user level.
Most Customer Success Managers operate at the account level and are concerned with key decision-makers and power users. They help customers define strategies. Operationalising and ensuring users are engaged is beyond their scope. That’s simply a prioritisation strategy as it’s not feasible for CSMs to tailor to each user in any given account.
But we know it’s effective to focus on the individual users too.
When you have a legion of active users who enjoy using your product, they have a bottom-up influence on their organisation. And unless a tyrannic boss shows up, or a big event such as an M&A or large lay-offs happens, your product is safe.
Customer Success depends heavily on product and marketing to deliver that “user-level” touch. The issue with that is that even the companies with the most sophisticated CS and Marketing functions have a gap in this process.
It’s unclear whose responsibility is to define customers’ “moments of truth”, and how to engage them effectively at those stages.
Should marketing send an email each time that a user’s feature usage drops? Should product build tutorials on pages that users haven’t navigated to before?
The reality is that, like anything else in CX, it’s teamwork. But instead of creating a CX organism, most companies end up creating an array of solutions that are owned by different teams, that run on different platforms. So you end up with a disjoint experience and data silos.
When that happens, your organisation moves slowly. It requires a bunch of analysts to get meaningful insights and drive improvements. As analysts are a rare commodity, it takes time to get anything done.
The most common asks for analysts are descriptive analysis (what happened) and diagnostic analysis (why it happened). Few organisations have the capabilities to perform predictive analysis (what could happen) and prescriptive analysis (what should happen). When they do, it’s still a point in time view, and it’s still not personalised.
You are always a few steps behind, playing catch up with customers’ challenges and opportunities, waiting until the next call in 6-8 weeks to spot a way to help your customer succeed.
Here is where data graphs can be a huge competitive advantage for your company:
Datagraphs super-personalise recommendations and deliver them in real time.
The more relevant your recommendations, the more engagement you get from users. Not just measured in time spent on your platform, but also in the quality of the engagement. Meaning, that users are logged in, performing actions that will help them achieve their goals.
The graphs are built using product engagement data, and proprietary algorithms.
Proprietary algorithms perform all four types of analysis (descriptive, diagnostic, predictive and prescriptive) in real-time. It identifies what is happening and why it’s happening, and makes predictions of what could and should happen.
For example:
- What: A customer performs the same action in your product multiple times (eg. send the same email to customers multiple times in your CRM)
- Why: The system learns that this is a common use case and finds other customers who also performed this action frequently
- What could/should happen: The system spots that other customers that perform the same action are using automation features (eg. templated emails and automated email workflows). By identifying this pattern the platform can make a recommendation to convert that email into a template and to build a workflow and with a few clicks get one built. For more complex features the user can be directed to a tutorial or to sign up for a webinar.
With a datagraph, your customer isn’t waiting for your CSM to spot that they send the same email 100 times to suggest the workflow feature.
A lot of people are sceptical of that level of automation. You often hear “a bad process automated, just means you are doing the wrong thing a thousand times”. This is why it’s important to not simply perform point-in-time analysis, but to adopt a “data-in-motion” approach. Where the system learns from actual users and their successes.
As you expand your datagraph capability, users will adopt more and more features of your product to solve business needs, thus your product will become stickier.
You’d be surprised to hear that at the start, only 2% of Netflix engaged with the recommendations, and now over 80% do!
How do you go about implementing datagraphs?
Here is where things get hairy.
The average organisation has data siloed in functional databases, which are oftentimes using different platforms. That’s just the way companies developed over time.
Datagraphs require you to think about data infrastructure differently than the traditional Frankenstein model. In order to deploy a successful datagraph, you will need a centralised data source that is machine-readable. This article is a fantastic first step to gaining a deeper understanding into machine learning on graphs.
For many organisations, it requires a complete revamp of their data architecture. So it’s not something a junior person in the org will be able to “make happen”.
It will take senior leadership to make a strategic commitment to becoming a truly smart company and investing in creating a data strategy. It will demand a specialised tech team in partnership with all business units to bring it to life.
A truly strategic, cross-functional and collaborative effort.
For those starting now, it’s worth getting into this model straight away. TikTok is a great example of a company that recently started by building a predictive algorithm at the core of its competitive advantage.
While it’s not a small feat to start this way, one thing is certain, it will cost a lot less time, money and headaches in the future.
This article was inspired by the HBR article ‘The Great Next Digital Advantage’.